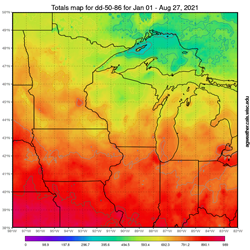
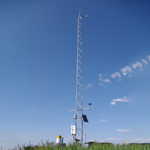
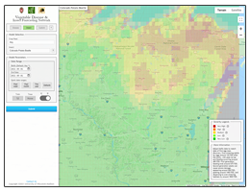
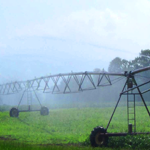
Weather Data

View daily maps and access single point or whole-grid data series for weather parameters including daily min, max, and mean temperatures, dewpoints, vapor pressures, and humidity. These data are collected daily from NOAA-generated grids. These grids are computed using advanced weather models informed by real-world weather observations and have superseded our old methodology of interpolating weather observations at airports across Wisconsin.


Precipitation Data

View daily maps and access single point or whole-grid data series for daily precipitation totals. Data is derived from NOAA-generated datasets.


Evapotranspiration Data

Maps of potential evapotranspiration (ET) are calculated from satellite-derived measurements of solar radiation and average air temperatures. The ET values on the maps are a reasonable estimate of daily crop water use for most crops that have reached at least 80% coverage of the ground. Prior to 80% or greater coverage, ET will be a fraction of the map value in proportion to the amount of coverage. The map values may vary slightly from ET estimates from AWON and other more site-specific models, but these differences are believed to be within the uncertainty of even measurements of actual water use made directly in a given field.


Insolation Data

Daily solar energy amounts are estimated using data in the visible portion of the spectrum which come from the Geostationary Operational Environmental Satellites (GOES). Simple physical models of radiative transfer for the clear and cloudy atmosphere are used with these data to evaluate whether a particular location is cloudy or clear and, if cloudy, to what extent clouds have depleted the solar beam. Usually, about eight to twelve individual GOES images are used during the course of a day to make estimates of the solar energy at the satellite image times. These instantaneous estimates are later summed to produce the daily solar energy totals.


HYD Reports

We offer online access to NWS HYD reports -- daily weather summaries of temperature and precipitation by volunteer observers -- for hundreds of locations throughout Wisconsin going back to 1995. The reports are text files, one per day.


Automated Weather Observation Network

From 1985-2017, we maintained automated weather stations at the Hancock and Arlington Ag Research stations. (Others were also operated in the 1980s-1990s.) They made hourly observations and daily averages for temperature, humidity, wind speed and direction, solar radiation, and soil temperature. Stations were discontinued in 2017. Since then data from Arlington and Hancock can be accessed via the Michigan State University Enviroweather Service.


Day-of-Year Calendar

Handy day-of-year calendar for any of the previous 50 and subsequent 50 years