Gridded Daily Weather Data
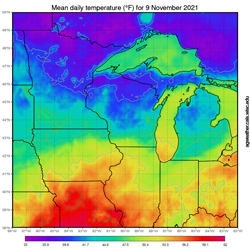
This gridded weather data is imported daily from the National Oceanic and Atmospheric Administration and includes air temperatures and dew points. From these data we compute vapor pressure and relative humidity. The map below shows mean daily air temperature, but all weather parameters may be viewed by clicking on the map or selecting a specific Latitude/Longitude and clicking 'Get Data Series' in the box below. Use the buttons above the map to view a different date.
Daily maps in the default units are already rendered by our server and can be browsed quickly. Changing units or using the cumulative map tool below will take around 10 seconds to render the image.
Daily map for Jan 31, 2026 (1 day ago)
Please wait, loading map may take up to 10 seconds...
Date: 2026-01-31
Units: F
Col: avg_temp
Stat: avg
Download weather data grid
Click here to download the entire gridded weather dataset for Jan 31, 2026 in csv format.
Get weather data for a single location
Choose a location and date range then click "Get Data Series". Daily min/max/average temperature, dew point, vapor pressure, hours high humidity, and average temperature during periods of high humidity will be shown in either Fahrenheit or Celsius. Note: you can click on the map or click the "Get my location" button to set the lat/lng.
