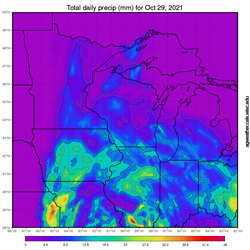
Gridded Daily Precipitation Data
Use this page to access gridded precipitation data for the upper Midwest. This data is collected daily from NOAA datasets, which are generated from a combination of real-world observations and computer modeling. Data is aggregated to a 0.1 decimal degree scale (roughly 8km E/W by 11km N/S in Wisconsin). Precpitation can be highly localized, so these data may not completely match observations from rain gauges or weather stations, but should be relatively close. Consider checking weather.gov or wunderground.com for weather/precipitation history or forecasts from an individual weather station.
Daily maps in the default units are already rendered by our server and can be browsed quickly. Changing units or using the cumulative map tool below will take around 10 seconds to render the image.
Daily map for Jan 31, 2026 (1 day ago)
Please wait, loading map may take up to 10 seconds...
Date: 2026-01-31
Units: in
Download data grid as csv
Download the entire grid of data for Jan 31 in CSV format.
Get data for a single location
Choose a location and date range then click "Get Data Series". Daily and cumulative precipitation will be displayed in mm and inches. Note: you can click on the map or click the "Get my location" button to set the lat/lng.
